|
"Students struggle to solve a worded problem in mathematics. Most students qualify their math errors as an inability to do the subject. Eventually some dislike it. In my last article, "A Cautionary Tale" I discussed the pitfall of the key word strategy. However, the article left my readers with more questions than answers.
Is there one strategy that helps students decipher word problem? A master strategy that can canvas any mathematical problem and yield a reasonable outcome. I think there is. A worded problem void of keywords might as well be read as this: Buffalo buffalo Buffalo buffalo buffalo buffalo Buffalo buffalo It’s a sentence by Dmitri Borgmann. Sure, you’d be able to say the words, but what would it mean? How would your mind operate on it? Early on, children are taught math using blocks, bottle caps and other group-able counters to assist them to visualize how numbers are added, subtracted, divided and multiplied. As student progress through the standards, numbers get larger and these resources become inadequate. Their capacity to solve mathematical problems depends solely on algorithmic procedures and keywords to guide their reasoning. This must change. Students must visualize. Task 1: Sharing Fairly I was asked to introduce the concept of statistical mean to a class of standard 4. The students had recently completed the concept of unequal sharing. In the task below they were given unit discs to work with. In groups, they discussed how unequally shared amounts could be shared fairly.  Table A Table A
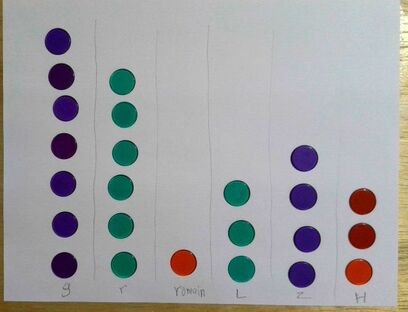
The boys’ excitement grew once I introduced the coloured counters and asked them to visualize the information shown in table A.
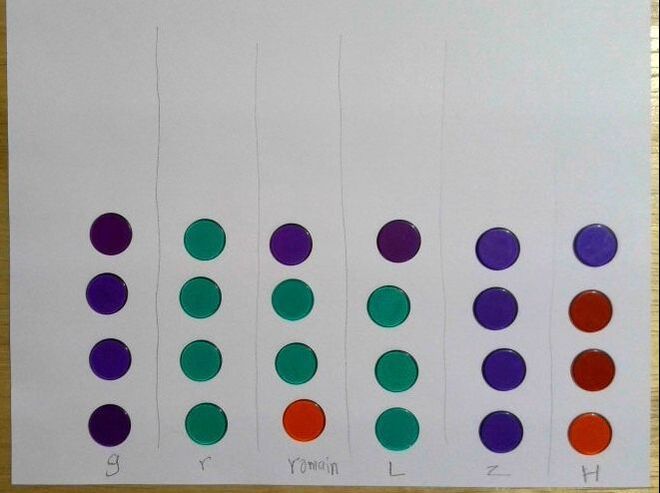
How would you have shared the snacks fairly? One of the students, worked feverishly calculating numbers. The others represented table A, as shown in Figure 1. Their individual input in the activity was expressed by various coloured discs used. Before long, their fingers were busy rearranging the discs as shown in figure 2.
The visualization activity opened a deeper conversation about how the boys imagined the snacks being shared. One student saw the sharing as taking snacks from those who had plenty and giving it to those who didn’t. Another student said purple and green would have to give up some snacks because they had way more than red. Others mentally divided to re-share the sweets so that everyone got equal amounts. All students were appreciative of each other’s explanation.
At the end of the session we discussed the efficiency of doing this exercise and how to mathematically show how we share equally.
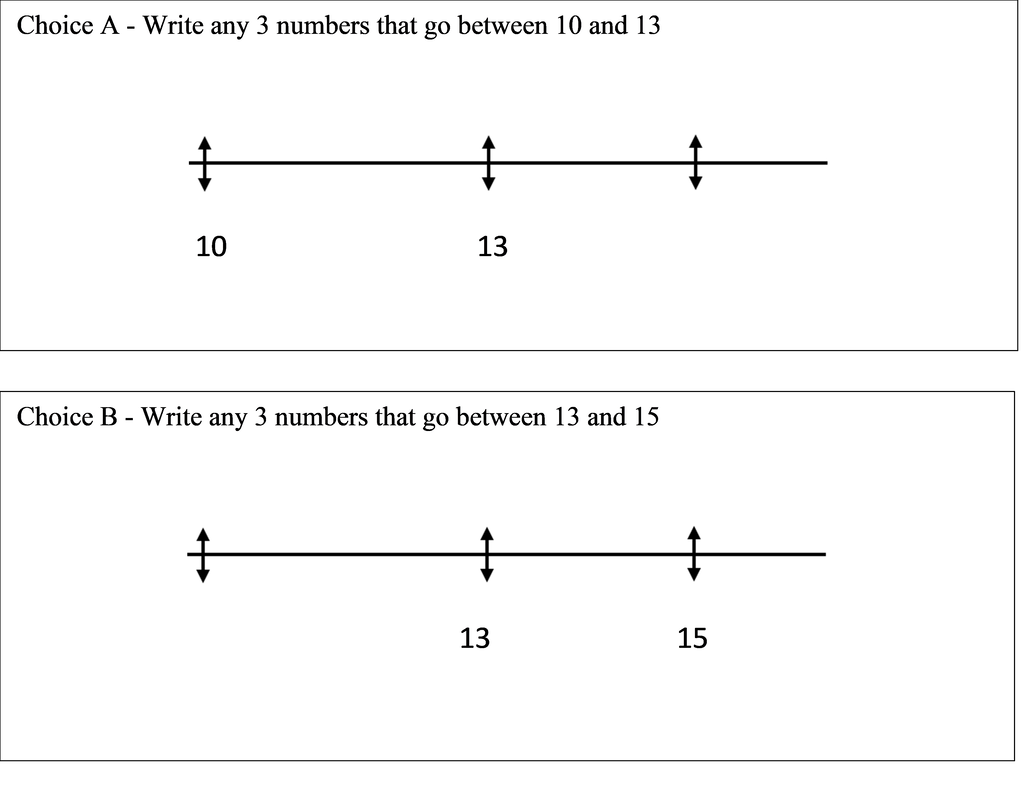
Well, I had been asked by a few parents to help their children with math. The students were given the choices as well. Individually, the children completed their activity. However, they were only able to identify the whole numbers between the pair of given numbers. I then asked them to think visually about where the numbers they suggested could go on the number line.
I said, “Think about where you’d put a number that go between 14 and 15. Mark that place in with your pencil.” 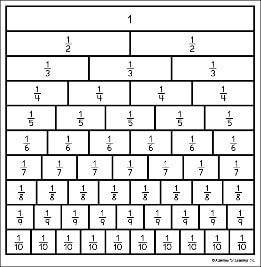 Figure 3 Figure 3
threeater, they were asked to think of other spots a number could fit. Before long conversation erupted. Kutarine said “We could get half.” Kadie’s marker was not in the middle of two whole numbers it was closer to 13 than it was to 14. She concluded that it had to be less than half. Chelsea explained it was a thirteen and one quarter. Additionally, they were curious about fractions that would be closest to 13. Using the chart shown in figure 3, we explored possible answers.
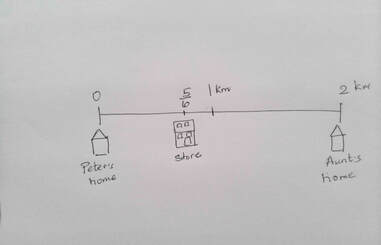
By the end of the session students had understood that mixed numbers and whole numbers could be represented on the same number line. They generalized that fractions such as two-thirds, three-quarters, five-sixths and so on, would represent markers closer to whole numbers since they combined to form fraction pieces that were almost the same length as one (1) whole. Task 3: Pool Position The distance between Peter’s home and his aunt’s house is 2 km. On his way to his aunt’s home, Peter walked 5/6 km to a clothing store to buy a swim pants. He travelled another 1/3 km from the store to the pool. After bathing he walked from the pool to his aunt’s home. How many kilometres is there from the pool to his aunt’s home? Figure 4 shows the initial attempt to visualize what was read. Figure 5 depicts two ways the students interpreted the pool's position.
Even though I had spent time focusing on counting in sixths, there were common misconceptions students had about the activity. They located 1/3 and 5/6 on the number line versus realizing that 1/3 was an added distance to the five-sixths. Kutarine, was confused once she visualized that the swimming pool was closer to Peter’s house than the store. The pupils were not able to initially apply how addition was meaningful for arriving at the pool’s location. However, together we re-read the problem and realized that the one-third was an additional part of the journey. The problem reinforced that fractions in linear measurement need not stop at one (1) whole but could be infinite. I allowed the students to further their conversation about representing a marker for the pool’s location. There was a unanimous rejection that the pool was at the 1/3 marker but there was some who accepted the pool should be at 1 1/3 km (which was also incorrect). This later required students to reason the need for addition to arrive at the pool’s distance.
In general, not every mathematical task needs to be inquiry-based. However, any true problem is novel in some small way. This is where visualization becomes a necessity. Thinking visually excites students, removes the notion that math is about right and wrong, allows dialogue and explores misconception and deepen pathways of thinking of concepts. Routine tasks on the other hand, do not need resources or drawings. There is nothing new, or strange in routine tasks. There you go. Begin visualizing with that next big problem. |

Whatsapp Only1(281)-769-2911
|
|